# Filter data based on parameter
selected_penguins <- penguins %>%
filter(species == params$species) %>%
drop_na()So far, we have created our report only for Adelie penguins. But what if we want the same report for all three penguin species? Instead of maintaining three separate documents, we can use parameters: A template that is filled with different values when rendering.
The concept
A parameterized report is like a form with blanks:
- The template defines parameters with default values
- When rendering, other values can be passed
- The report adapts automatically
Defining parameters
Parameters are defined in the YAML header under params::
---
title: "Penguin Report"
format: docx
params:
  species: "Adelie"
---
Here, species is the parameter name and "Adelie" is the default value.
Using parameters in code
In R code, you access parameters with params$parametername:
The body text can also contain parameters:
This report analyzes **Adelie** penguins.A complete example
Here is our penguin report as a parameterized version:
---
title: "Penguin Report"
subtitle: "Adelie Penguins"
author: "Research Team"
date: today
format: docx
params:
  species: "Adelie"
execute:
  echo: false
  warning: false
  message: false
---
# Introduction
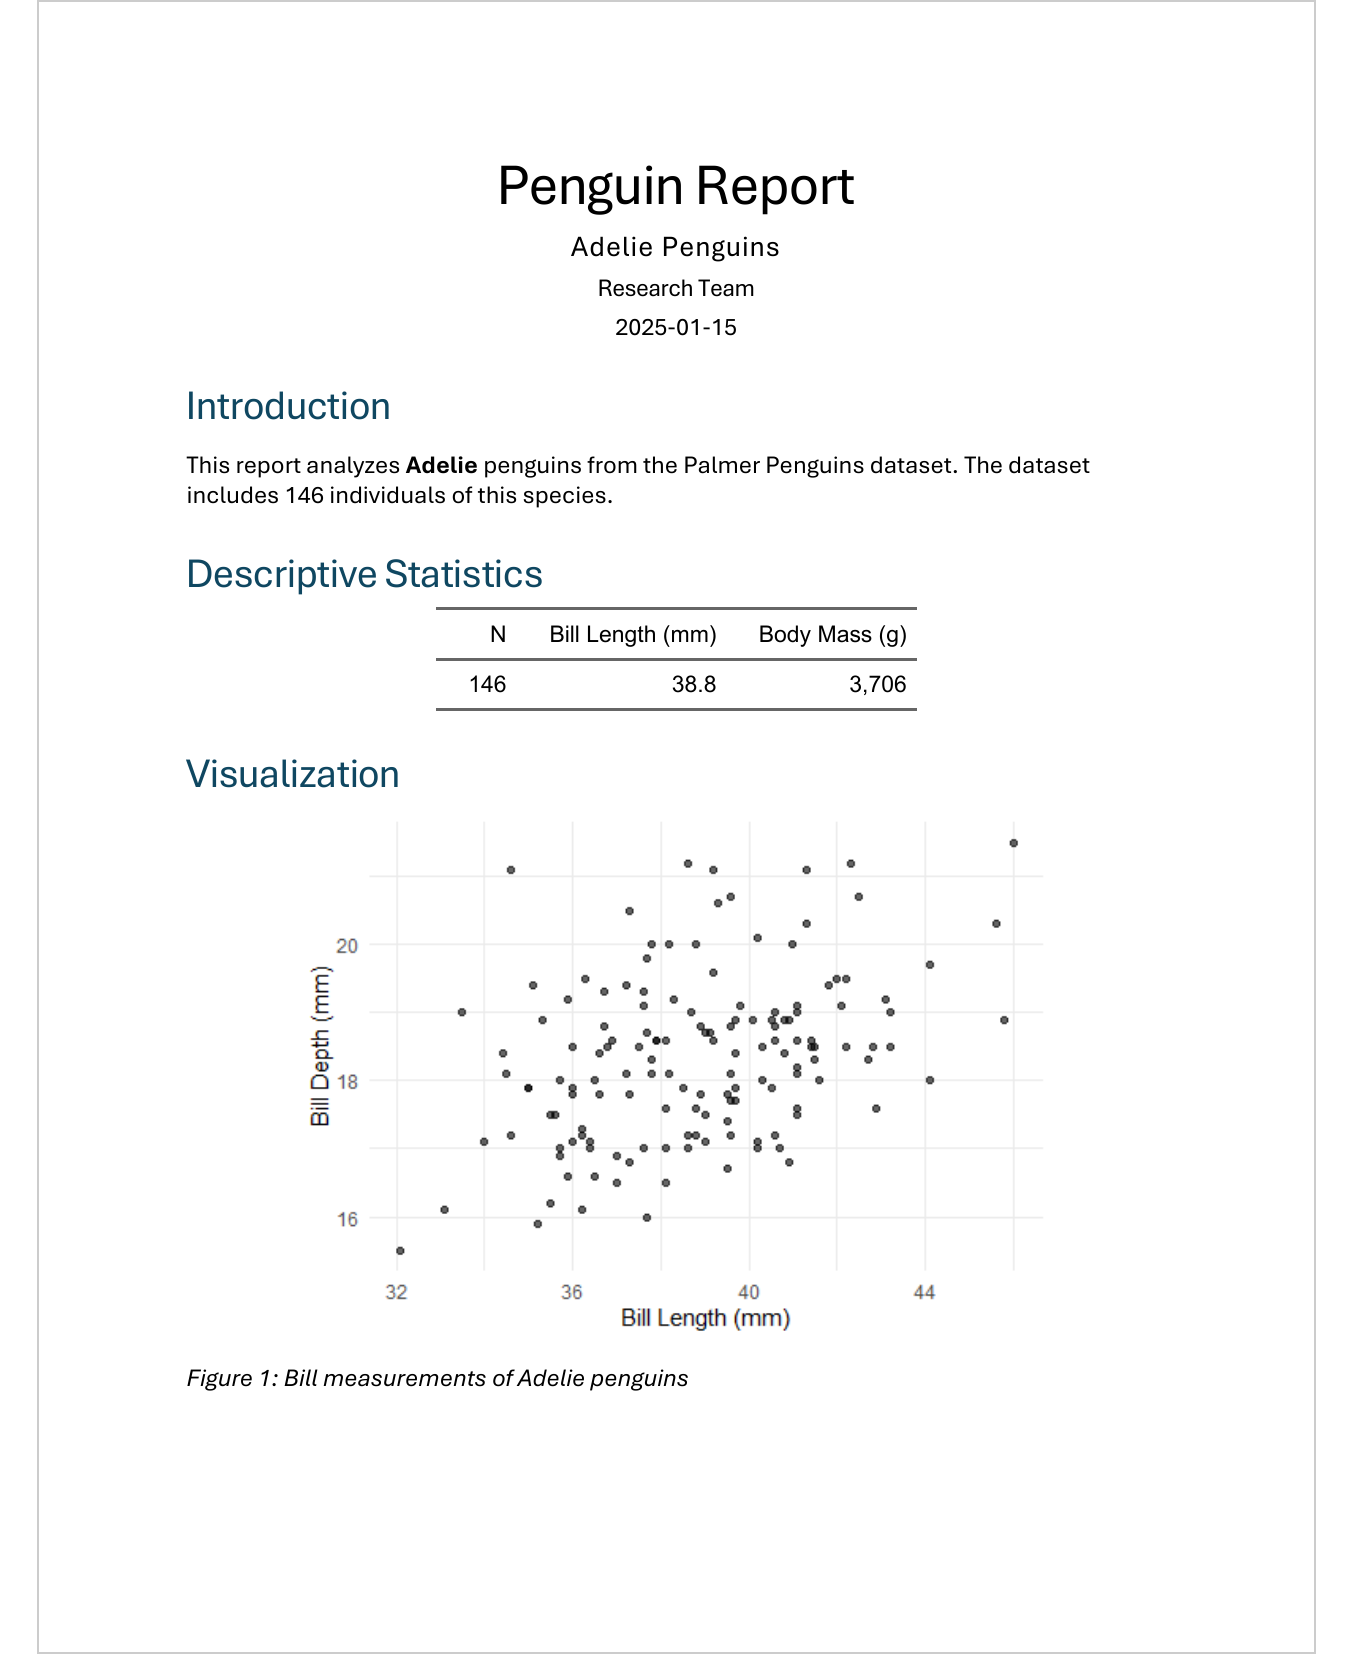
This report analyzes **Adelie** penguins from the
Palmer Penguins dataset. The dataset includes 146
individuals of this species.
# Descriptive Statistics
```{r}
#| label: tbl-params-summary
#| tbl-cap: "Summary of measurements"
selected_penguins %>%
summarise(
N = n(),
`Bill Length (mm)` = round(mean(bill_length_mm), 1),
`Body Mass (g)` = round(mean(body_mass_g), 0)
) %>%
flextable() %>%
autofit()
```
# Visualization
```{r}
#| label: fig-params-scatter
#| fig-cap: "Bill measurements of the selected penguin species"
#| fig-width: 5
#| fig-height: 4
ggplot(selected_penguins, aes(x = bill_length_mm, y = bill_depth_mm)) +
geom_point(alpha = 0.6) +
labs(
x = "Bill Length (mm)",
y = "Bill Depth (mm)",
title = glue::glue("{params$species} Penguins")
) +
theme_minimal()
```The same template produces completely different reports depending on the parameter value. Here is a side-by-side comparison of the Adelie and Gentoo variants:
species: "Adelie"
species: "Gentoo"
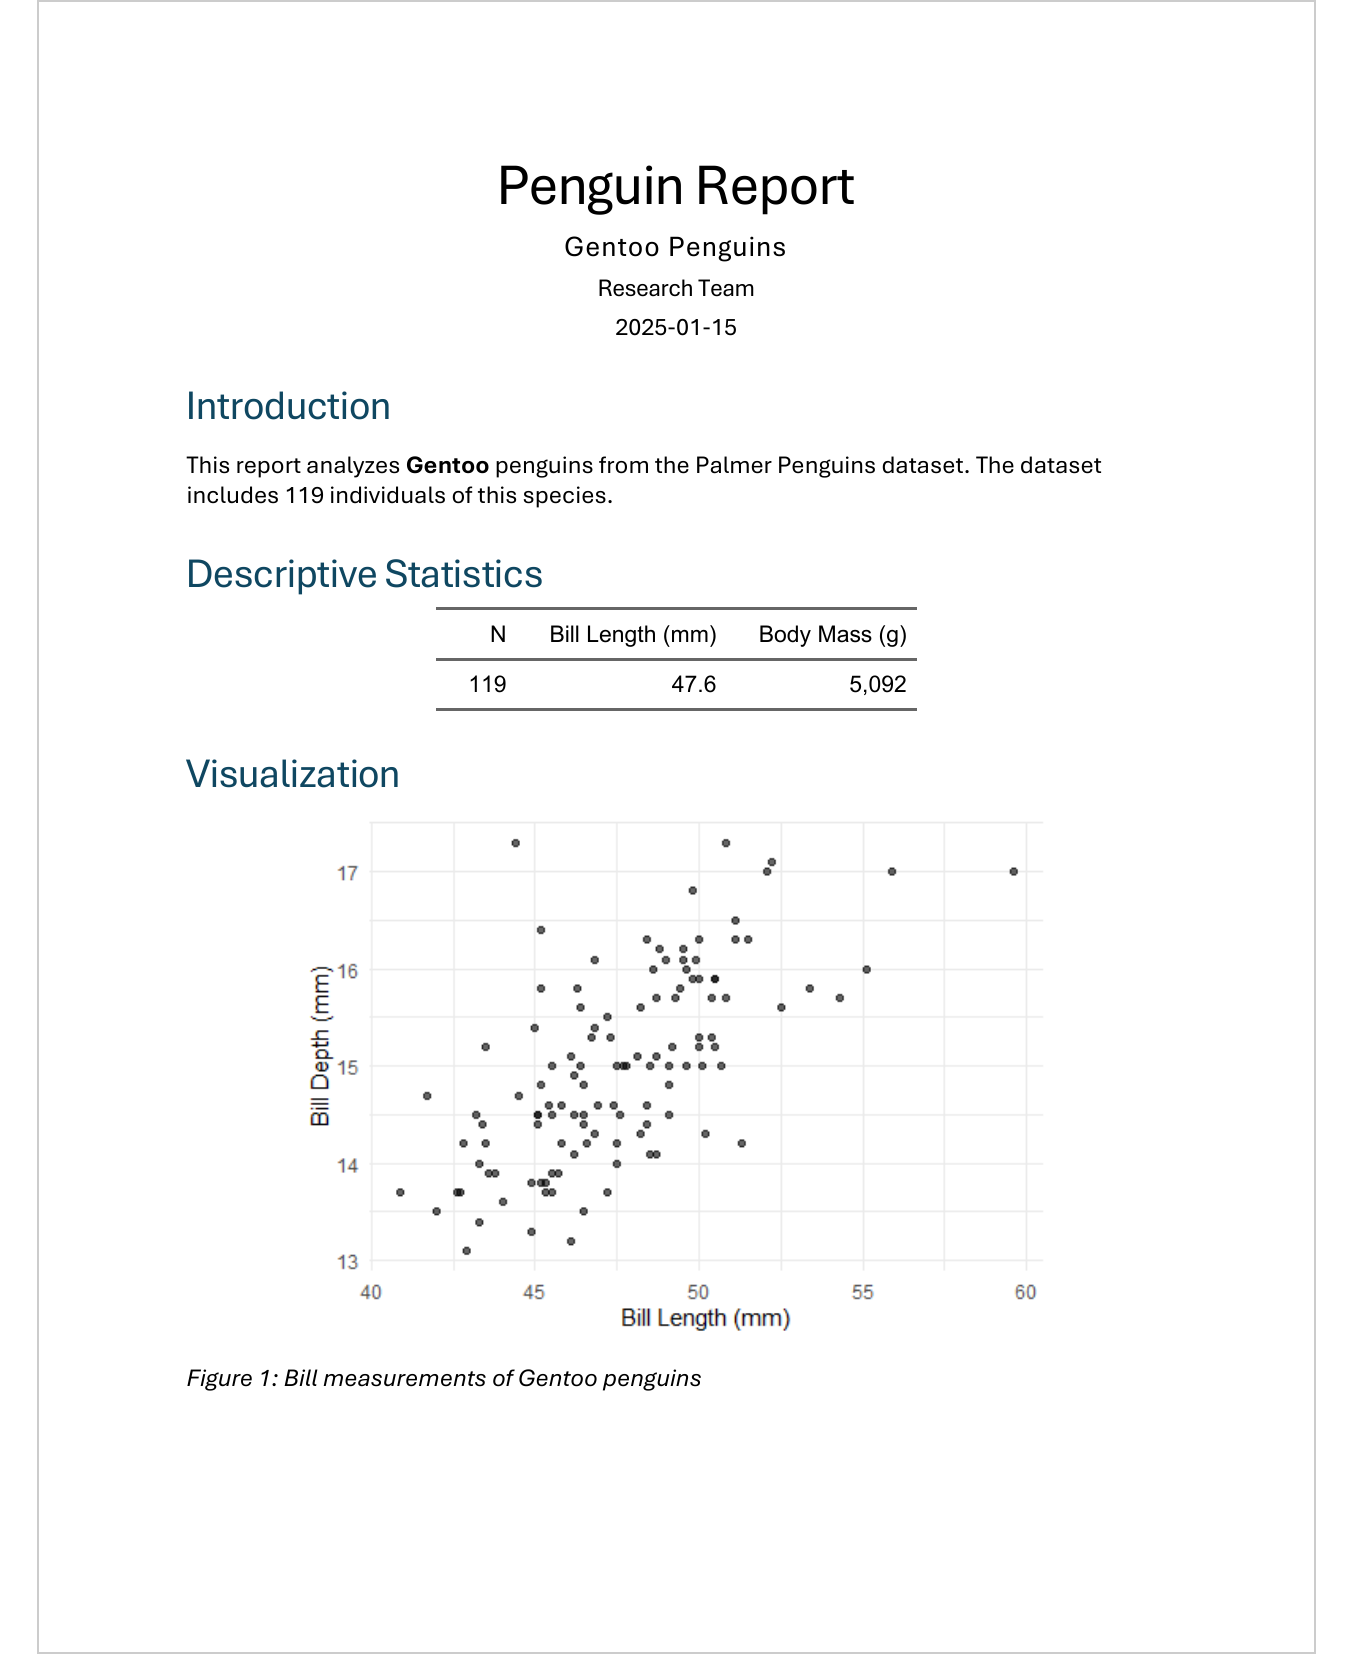
Notice how the subtitle, text, table values, and even the scatterplot change automatically - all from a single template.
Rendering with different parameters
In RStudio
- Click on the arrow next to the Render button
- Select “Render with Parameters…”
- A dialog opens where you can change the values
Via command line
quarto render report.qmd -P species:GentooMultiple parameters:
quarto render report.qmd -P species:Chinstrap -P year:2008Programmatically in R
# Render one report
quarto::quarto_render(
  input = "report.qmd",
  execute_params = list(species = "Gentoo"),
  output_file = "report_gentoo.docx"
)
Rendering all variants at once
With a loop, you can automatically generate all versions:
This creates three files: report_adelie.docx, report_chinstrap.docx, report_gentoo.docx.
Multiple parameters
You can define any number of parameters:
params:
  species: "Adelie"
  island: "Biscoe"
  min_year: 2007
  include_plots: true
And in code:
Parameter types
Parameters can have different types:
params:
  species: "Adelie"           # Text
  sample_size: 100            # Number
  include_plots: true         # Boolean
  islands:                    # List
    - Biscoe
    - Dream
Dynamic titles
The title can contain parameters:
---
title: "Adelie Penguin Analysis"
params:
  species: "Adelie"
---
Or simpler in the subtitle:
---
title: "Penguin Analysis"
subtitle: "Adelie"
params:
  species: "Adelie"
---
Practical use cases
| Application | Parameters |
|---|---|
| Reports per region |
region, year
|
| Client reports |
client_name, client_id
|
| Test versions | include_draft_watermark: true |
| Language versions | language: "de" |
| Data sources | data_file: "data_2024.csv" |
Tips
Set sensible defaults
The default value should be a typical, working value - this way you can easily test the template.
Validate parameter values
At the beginning of the document, check if the parameters are valid:
Output file names
When mass-producing, use meaningful file names:
output_file = glue::glue(
  "report_{params$species}_{Sys.Date()}.docx"
)
TipExercise: Create a parameterized report
- Take the previous penguin report
- Add a
speciesparameter with default value “Adelie” - Replace all places that refer to Adelie with
params$species - Render the report with different species (Adelie, Chinstrap, Gentoo)
- Bonus: Write a loop that automatically generates all three reports
Further resources
- Quarto Parameters - Official documentation
- Parameterized Reporting with Quarto - Rendering options
What is next
In the final chapter, we will look beyond Word: PDF export with Typst, presentations with Reveal.js, and HTML documents - all with the same Quarto knowledge.
Citation
BibTeX citation:
@online{schmidt2026,
  author = {{Dr. Paul Schmidt}},
  publisher = {BioMath GmbH},
  title = {10. {Parameterized} {Reports}},
  date = {2026-03-12},
  url = {https://biomathcontent.netlify.app/content/quarto/10_parameters.html},
  langid = {en}
}
For attribution, please cite this work as:
Dr. Paul Schmidt. 2026. “10. Parameterized Reports.”
BioMath GmbH. March 12, 2026. https://biomathcontent.netlify.app/content/quarto/10_parameters.html.